Sunday, October 04, 2015

Astronephrologist

Dumb bell nebula, M27.
After just being perversely interested in space and stars for ever I have actually started with what everyone really dreams of. Astronomy and telescopes (if you don't agree, you're probably in the wrong place on the internet). Anyway, I have been building up to getting a telescope for a long time, it's hard to choose. On one hand we want a telescope that gives good results so as not to get disheartened, on the other hand we don't want to get in too deep. So, I did what any amateur worth his salt would do, I surfed the internet. A lot. No, not alot, a lot.

Eventually I decided on a telescope, or three, but today we'll discuss learning proper astrophysics online. While surfing around I came across these wonderful astronomy courses on edX.org given by Paul Francis and Brian Schmidt at the Australian National University. There are four courses: Greatest unsolved mysteries of the universe, Exploring exoplanets, The violent universe, and Cosmology. Together they correspond to ANU's first year of astrophysics. If you would like to start a bit more basic there's also the Introduction to solar systems astronomy given by Frank Timmes at Arizona State University.

Genetics and medicine has little compared to astronomy when it comes to data availability. It turns out that most catalogues of stars, galaxies, etc. get turned into public databases fairly quickly, which is reasonable given the small number of really large telescopes and space missions compared to the amount of data one of these can collect (Oh, and the number of undergrads astrophysics departments around the world have to contend with). So, I downloaded the Hipparcos and Tycho2 catalogues and played around with them in R. Good fun for summer vacation. I might write a bit more about that later. Here's a star density plot of the Tycho2 data for now.

Tycho2 star density in a galactic aitoff projection produced using R. We can clearly see the dust clouds that obscure parts of the galaxy from view.
 With that I have decided I am now an Astronephrologist, bringing knowledge of the stars back to nephrology. I'm sure this combination will bring new insights into the development of diseases and future fortunes in a way astronomy and nephrology by themselves never could. I shall call this new science: Astrology!

Wednesday, April 08, 2015

A more reasonable look at exercise guidelines

We are going to revisit the exercise guidelines because there is a new meta analysis in JAMA of Leisure Time Physical Activity and Mortality: A Detailed Pooled Analysis of the Dose-Response Relationship that tries to answer the question of how much training is optimal in a more precise way. As we discussed previously, the official exercise recommendations can be hard to understand from an amateur or elite athlete's perspective. Training at that level is not focused on health benefits per se, but on improving performance. The problem lies in the rough dichotomies for both time and intensity in the guidelines. For example:
"Adults aged 18–64 should do at least 150 minutes of moderate-intensity aerobic physical activity throughout the week or do at least 75 minutes of vigorous-intensity aerobic physical activity throughout the week" (WHO exercise guidelines 2010)
In my previous post we saw that I managed 164 minutes per week on average over a two year period including about 20% strengthening that should be counted separately. If we work that out, it is about 132 minutes aerobic training (mostly judo) and 32 minutes strength training per week. That is enough exercise if we count judo as a vigorous activity, which seems reasonable. However, we note that it does not reach the optimum of 300 minutes of moderate-intensity or 150 minutes of vigorous-intensity exercise plus two sessions of strength training per week. At the same time it is at the top level of recreational judo. So, something is not quite right.

The first problem we will tackle is the amount of exercise. The best way of measuring physical activity is using prospective logging. That is, each participant maintains a detailed log of all activities, usually for a week. This measure corresponds well with energy expenditure measured using doubly labelled water. However, for the kind of large epidemiological studies used to base the exercise guidelines on that is too much work. Instead they rely on seven-day recall questionnaires, which basically means asking the participants what they did last week hour by hour. This is a poor estimate of actual exercise but an acceptable measure for comparing different groups of people or the same people at different time points. As expected people tend to over estimate their physical activity using the recall method. One study found an average under estimation of 40% for total duration of exercise but a massive four-fold over estimation of vigorous exercise using recall instead of logs. The result was a 70% over-estimate of exercise amount when corrected for intensity. In addition, being part of a study means that logged exercise will probably be larger than exercise during an average non-logged week. Importantly, any of the methods will probably over estimate the average amount of exercise compared to a long-term exercise log, which includes vacations, injuries, and general laziness. Anyway, this is an important part of the reason why the guidelines basically give two intervals for training amount: Less than 150 minutes/week is bad for you, and more than 150 minutes/week is good for you.

Our second scab to pick is the intensity, which is dichotomised to moderate or vigorous both in the guidelines and in the original publications. Moderate is walking or bicycling in a brisk pace, but not strenuously. Vigorously is anything more intensive than walking or bicycling, for example jogging or swimming. Behind this artificial dichotomy lies the actual activities and in research about physical activity the intensity of different forms of exercise is quantified in metabolic equivalents or METs. The number of METs that an activity has is determined by how many times the resting energy expenditure the activity consumes. Using the kind of exercise and the number of hours we can then calculate an amount of exercise corrected for intensity. This is called MET-hours, that is the number of hours of exercise at a given MET-intensity. The minimum exercise in the guidelines correspond to 7.5 MET-hours per week, and the higher goal for additional benefits is accordingly 15 MET-hours/week.

Using the Compendium of physical activities we can calculate how many MET-hours my training actually corresponds to. Judo has a MET of 10 and weightlifting 6. This works out to 22 MET-hours Judo and 3 MET-hours strengthening for a total of 25 MET-hours, which is satisfyingly above the goal for maximum benefit.
Figure 1 adapted from Leisure Time Physical Activity and Mortality: A Detailed Pooled Analysis of the Dose-Response Relationship by Hannah Arem and co-workers, JAMA Internal Medicine 6 Apr 2015.
Finally, we can get back to the new analysis. What they did was go back to the original data and use the MET-hours recorded for each participant at leisure-time physical activity (i.e. exercise). This was then compared to the risk of death for different amounts of intensity corrected exercise. In figure 1 we can see that we can lower our risk of death by up to 40% by training more than 22 MET-hours per week and less than 75 MET-hours per week. However, we also see that the dichotomy holds. If we train at least 7.5 MET-hours per week we get the bulk of the benefit.

We can conclude that how long we, or our patients, should train depends very much on the type of training. When using these guidelines, even with correction for type of training, we should remember that they are based on reducing the risk of death. They are not meant to help you improve performance, certainly not at the serious amateur or elite level. Finally, while we can understand the reasoning behind making the guidelines as easy as possible, it would be useful to explain how to grade different forms of exercise quite early in the actual guidelines instead of leaving it to the reader to find in original sources.

Saturday, March 07, 2015

Meta analysis in R

or 

the beneficial effect of teaching on research

I have been fascinated by meta analysis for a long time. It is so obviously the right way to approach the true effect of an intervention. Recently, an old binder presented itself in a pile of shite bunch papers I meant to read but found myself throwing in the bin tidying away. It contained the draft of a database of physiological data from the first years of my PhD. The idea was to compare all the baseline data from our kidney research group in Uppsala to look at the effect of the models as such and the interventions that were used repeatedly. With the insight of the intervening years it seems a lot less interesting now, but I still have the feeling that some areas of experimental research could benefit from meta analysis.

Which brings us to the the story I am about to tell. Four or five years ago, when I moved back to Uppsala, I got offered a lecture on physiological changes in the elderly. It was to be part of a final year course for the master in biomedicine programme. Just a single hour to show how all the physiology from the rest of the programme changed with age. To compare and contrast ageing as such with the accrued ailments of living for a long time, and distinguish these from the chronic and age related disease. It was not a huge success, but given the title I was not too disillusioned. The second year I was given two hours. Still a bit on the short side, but one hundred percent better than one.

It is not the most popular lecture, but I have had it for five years now and one of the things I teach is that some parts of ageing is caused by metabolism itself. The burning of oxygen singes the organism and with time it will break much like the paneling in an old sauna. As proof of this I used the idea of caloric restriction, which can prolong life in many strains of yeast, mice, and rats. Then, in 2012 an article was published on the effect of caloric restriction in the Rhesus monkey, a primate, and reasonably the closest relative to humans in which an experiment could be expected to be finished any time soon. It showed no effect. I happily included this in my lecture as a counter-point. Until in 2014, when updating the lecture for a new semester, I found that another experiment with caloric restriction in Rhesus monkeys had published their data and found a clear difference.

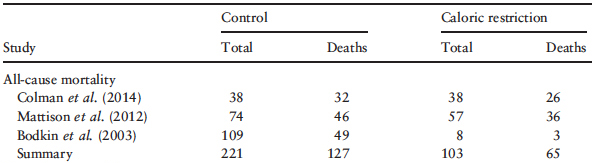
This made it hard to continue the lecture as I had done, I could just show both studies and say that we don't know. But the total number of animals included was quite large, and the effect measure very straight-forward. Death. So, I performed a meta analysis of mortality of these two studies, and a third smaller study published in 2003. This is the story of that analysis.

Quickly I installed the R package rmeta by Thomas Lumley and set to work. It is quite easy really, we start with setting up a table of results from the included studies. The table should include the total number of subjects in each group, and the number of deaths per group.

Hultström, M. Acta Physiol (Oxf). 2015 Feb 14. doi: 10.1111/apha.12468.
The we push this trough the rmeta function meta.MH(). To get a forest plot, we just run the plot() command, which has a default for handling the result of meta.MH() in the form of a forest plot. If you have a larger meta analysis there is also the funnelplot() that can be used to assess publication bias. Anyway, the result is quick and easily understood, which is really one of the major strengths of the forest plot.

Hultström, M. Acta Physiol (Oxf). 2015 Feb 14. doi: 10.1111/apha.12468.
There was no significant effect of caloric restriction on all cause mortality in Rhesus monkeys. Or, rather there was a small, clearly non-significant, effect. One of the reviewers asked what would be needed to show if this effect was true. That is, could I please perform a power analysis. So, I installed the pwr package and ran a 2p2n.test() using the most generous effect estimate, i.e. a hypothetical study that ran to completion where the whole control population had died giving an effect of 0.08. This resulted in a required population of 2806 subjects to reach 85% power. This is the power-level which is normally used as the basis for power calculation in clinical studies. However, the age-related mortality was a different story that you can find in the actual article.

The next thing that surprised me was how difficult it was to get this simple little analysis published. It appears that experimental journals don't publish meta analyses, and clinical journals that publish meta analyses, don't publish experimental results. Finally, I found a benevolent editor at Acta Physiologica who permitted it to be published as an editorial. So that is where it resides today, and finally I can give a fairly clear answer in my lecture on the effect of reducing metabolism by caloric restriction on ageing and on mortality. Only problem is, I now have to explain meta analysis and forest plots before I can show the actual data.

And, no I am not going to starve myself so that I can avoid some diseases we can treat in favour for a frailty for which the only known treatment is eating more.

Sunday, January 04, 2015

Fujifilm X100T first impressions

My Fujifilm X100T arrived on January 2nd so I have had all of two days to try it out. A while back I wrote a list of what I would like to see in the X100S replacement that was anticipated for Foto Kina. There were nine items on the list and most have been fulfilled, or at least significantly improved with X100T.
1. The burst mode does not lock the camera so it is possible to take another burst almost directly. 
2. There is a setting for release priority, and it is separate for continuous and single shot focus so that you can have one for each. 
3. There is no tab on the focus wheel, nor is there always-on manual focus. However, the manual focus is excellent with split-screen, peaking, and 100%-preview modes. 
4, 6, 7, & 8. While there are no dedicated switches, there is a drive-mode button for selecting single, continuous, bracketing, or film mode, and there are seven programmable buttons that I have programmed to cover my needs. 
5. There is no dedicated ISO dial. Although, I have high hopes for a firmware update that lets you use the exposure-compensation dial for ISO. It should be easy, really
9. While there is no touch screen, the buttons are much better with a dedicated back button to get out of menus.
As you see, it still does not have a manual ISO dial, but otherwise I am happy. It is a massive improvement above the X100, which, given how much I liked the X100, is no idle praise. The film simulation is particularly useful when working in black and white, I have the camera set that way and have Adobe Lightroom set up to import as low-contrast black and white. It works excellently. High ISO is excellent up to 6400. I haven't had use for higher ISO seeing as I am only in Sweden in January, and not in a mine. Macro shooting also works well, at f2 the actual focus seems to lie slightly in front of the apparent focus using peaking manual focus, and autofocus is not the most accurate. Honestly, f2, autofocus, and macro are three things that don't generally go together. So, I can't really fault the camera for that.

Here are some examples from the first days of shooting. As you see it works right out of the box for boxer snaps.

With a little bit of thought it can take quite nice portraits.


And night-time shooting at ISO 6400 is no problem and gives very presentable result.